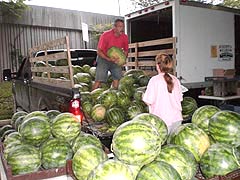

Baltimore Farmers' Market, Holliday St. & Saratoga St., Baltimore, Maryland, August 2013. Photo by Diane F. Evartt.
| 2010 | 2011 | ||||
| Dairy Products | $182,712,000 | $214,526,000 | |||
| Feed Crops (barley, corn, hay, oats) | $194,371,000 | $280,141,000 | |||
| Food Grains (wheat) | $38,381,000 | $86,025,000 | |||
| Fruits/Nuts | $19,018,000 | $20,784,000 | |||
| Livestock (miscellaneous) & Products | $24,975,000 | $25,170,000 | |||
| Meat Animals | $76,402,000 | $86,974,000 | |||
| Oil Crops (primarily soybeans) | $167,736,000 | $201,009,000 | |||
| Other Crops (includes greenhouse/nursery, floriculture) | $321,535,000 | $326,796,000 | |||
| Poultry/Eggs | $745,477,000 | $784,237,000 | |||
| Vegetables | $66,607,000 | $65,726,000 | |||
| TOTAL | $1,835,214,000 | $2,091,388,000 | |||
![[photo, Baltimore Farmers' Market, Holliday St. and Saratoga St., Baltimore, Maryland]](/msa/mdmanual/01glance/agriculture/images/1198-1-2548.jpg)
Baltimore Farmers' Market, Holliday St. & Saratoga St., Baltimore, Maryland, November 2007. Photo by Diane F. Evartt.
| 2005 | 2006 | 2007 | 2008 | 2009 | |
| Dairy Products | $183,870,000 | $151,524,000 | $208,800,000 | $194,180,000 | $144,565,000 |
| Feed Crops (barley, corn, hay, oats) | $122,702,000 | $142,393,000 | $165,264,000 | $220,403,000 | $203,647,000 |
| Food Grains (rye, wheat) | $26,611,000 | $33,632,000 | $55,561,000 | $94,681,000 | $61,071,000 |
| Fruits/Nuts | $15,117,000 | $16,890,000 | $18,359,000 | $19,144,000 | $18,512,000 |
| Livestock (miscellaneous) & Products | $19,935,000 | $17,787,000 | $16,830,000 | $18,292,000 | $21,315,000 |
| Meat Animals | $89,322,000 | $91,596,000 | $86,466,000 | $78,639,000 | $55,441,000 |
| Oil Crops (primarily soybeans) | $85,818,000 | $86,248,000 | $96,417,000 | $129,620,000 | $166,872,000 |
| Other Crops (includes greenhouse/nursery, floriculture) | $224,147,000 | $222,564,000 | $226,988,000 | $228,685,000 | $330,325,000 |
| Poultry/Eggs | $678,850,000 | $648,627,000 | $790,023,000 | $817,446,000 | $687,930,000 |
| Tobacco** | $2,674,000 | ||||
| Vegetables | $71,214,000 | $59,664,000 | $73,956,000 | $76,702,000 | $68,942,000 |
| TOTAL | $1,520,261,000 | $1,470,925,000 | $1,739,664,000 | $1,887,792,000 | $1,760,263,000 |
![[photo, Hen, Annapolis, Maryland]](/msa/mdmanual/01glance/images/1198-1-493.jpg)
Hen, Annapolis, Maryland, August 2003. Photo by Diane F. Evartt.
| 2000 | 2001 | 2002 | 2003 | 2004 | |
| Dairy Products/Milk (wholesale) | $181,035,000 | $208,008,000 | $170,412,000 | $160,265,000 | $188,360,000 |
| Feed Crops (barley, corn, hay, oats) | $110,239,000 | $119,970,000 | $98,847,000 | $114,686,000 | $149,292,000 |
| Food Grains (rye, wheat) | $23,474,000 | $27,855,000 | $35,561,000 | $17,336,000 | $28,123,000 |
| Fruits/Nuts | $13,319,000 | $14,748,000 | $11,659,000 | $13,282,000 | $12,977,000 |
| Livestock (miscellaneous) & Products | $55,708,000 | $60,521,000 | $48,419,000 | $48,253,000 | $8,011,000 |
| Meat Animals | $76,368,000 | $68,015,000 | $74,119,000 | $87,632,000 | $86,685,000 |
| Oil Crops (primarily soybeans) | $85,370,000 | $80,935,000 | $62,118,000 | $81,081,000 | $110,934,000 |
| Other Crops (includes greenhouse/nursery, floriculture) | $292,073,000 | $303,686,000 | $334,257,000 | $338,412,000 | $254,678,000 |
| Poultry/Eggs | $522,709,000 | $612,805,000 | $491,060,000 | $548,680,000 | $680,867,000 |
| Tobacco | $15,106,000 | $13,620,000 | $5,938,000 | $5,119,000 | $2,292,000 |
| Vegetables | $81,370,000 | $85,860,000 | $59,761,000 | $46,979,000 | $60,326,000 |
| TOTAL | $1,456,771,000 | $1,596,023,000 | $1,392,151,000 | $1,461,725,000 | $1,582,545,000 |
![[photo, Grazing cows, farmland, Frederick County, Maryland]](/msa/mdmanual/10dag/images/i002130b.jpg)
Grazing cows, farmland, Frederick County, Maryland, 1998. Photo by Diane P. Frese.
| 1996 | 1997 | 1998 | 1999 | ||
| Dairy Products/Wholesale Milk | $199,206,000 | $181,608,000 | $208,967,000 | $203,250,000 | |
| Eggs | $62,221,000 | $53,802,000 | $50,358,000 | $44,625,000 | |
| Feed Crops (barley, corn, hay, oats) | $171,987,000 | $119,643,000 | $95,373,000 | $78,372,000 | |
| Food Grains (rye, wheat) | $53,695,000 | $43,680,000 | $25,371,000 | $24,266,000 | |
| Forest Products | $30,280,000 | $32,168,000 | $31,900,000 | $32,392,000 | |
| Fruits/Nuts | $12,364,000 | $18,313,000 | $15,264,000 | $13,746,000 | |
| Greenhouse/Nursery | $230,409,000 | $238,002,000 | $263,840,000 | $263,482,000 | |
| Livestock (miscellaneous) & Products | $66,905,000 | $72,209,000 | $61,007,000 | $61,823,000 | |
| Meat Animals | $61,577,000 | $80,131,000 | $70,735,000 | $70,876,000 | |
| Mushrooms*** | $1,594,000 | $1,661,000 | $1,862,000 | $2,020,000 | |
| Oil Crops (primarily soybeans) | $101,346,000 | $109,880,000 | $82,220,000 | $66,446,000 | |
| Other Seed & Field Crops | $21,541,000 | $18,170,000 | $17,388,000 | $14,590,000 | |
| Poultry | $526,804,000 | $546,117,000 | $551,001,000 | $548,246,000 | |
| Tobacco | $19,202,000 | $18,091,000 | $15,761,000 | $14,833,000 | |
| Vegetables | $72,892,000 | $73,200,000 | $79,564,000 | $87,130,000 | |
| TOTAL (all commodities) | $1,601,743,000 | $1,574,507,000 | $1,538,710,000 | $1,493,706,000 | |
Maryland Government
Maryland Constitutional Offices & Agencies
Maryland Departments
Maryland Independent Agencies
Maryland Executive Commissions, Committees, Task Forces, & Advisory Boards
Maryland Universities & Colleges
Maryland Counties
Maryland Municipalities
Maryland at a Glance
? Copyright Maryland State Archives